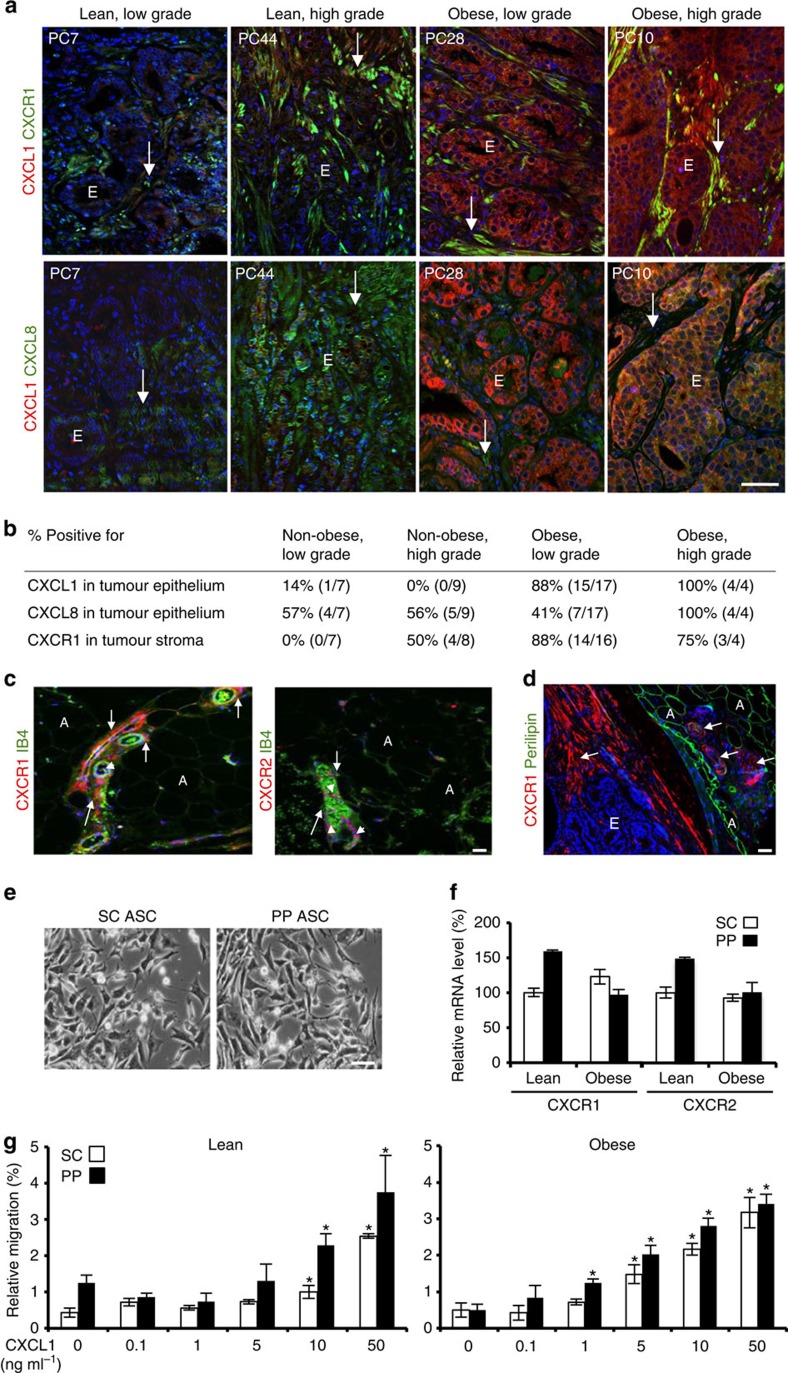
Figure 2. Human chemokine/receptor expression in prostate cancer and WAT.
(a) Immunofluorescence (IF) analysis of representative tumour samples from identified patients belonging to the specified groups with antibodies against CXCL1, CXCL8 and CXCR1 with red and green fluorophore-conjugated secondary antibodies. Yellow colour indicates protein co-expression. Arrows, stroma; E, epithelium. Blue, nuclei. Scale bar, 100 μm. (b) Analyses of protein expression in the tumour based on the data for 37 patients (Supplementary Fig. 1c). Per cent of patients presenting indicated protein expression within each group is shown. (c) IF analysis of representative human periprostatic WAT samples with antibodies against CXCR1 and CXCR2 counterstained with endothelium-specific isolectin B4 (IB4), showing that perivascular stroma (arrows) expresses CXCR1, while CXCR2 is only expressed in leukocytes (arrowheads) observed inside blood vessels. A, adipocytes. Scale bar, 100 μm. (d) IF analysis of a representative human tumour/PP WAT junction showing CXCR1 expression by the stroma of tumour and WAT (arrows) and perilipin-1 expression by adipocytes. Scale bar, 100 μm. (e) Bright-field micrographs of adherent ASCs from SC and PP WAT of an obese prostate cancer patient. Scale bar, 100 μm. (f) RT–PCR analysis quantifying CXCR1 and CXCR2 messenger RNA expression in ASCs isolated from SC and PP WAT of obese and non-obese patients. Data are normalized to 18S RNA. (g) ASCs isolated from SC and PP WAT of obese and non-obese patients were subjected to migration through 8-μm pores towards increased indicated concentrations of CXCL1 in a transwell chamber. Plotted are relative migrated cell numbers normalized to migration of SC ASCs towards 10% FBS (set at 100%). Experiments in (a,c–e) were performed for three patients; representative images are shown. In f and g, graphs show mean±s.e.m. for technical triplicates; *P<0.05 (Student's t-test) versus control (no CXCL1).

