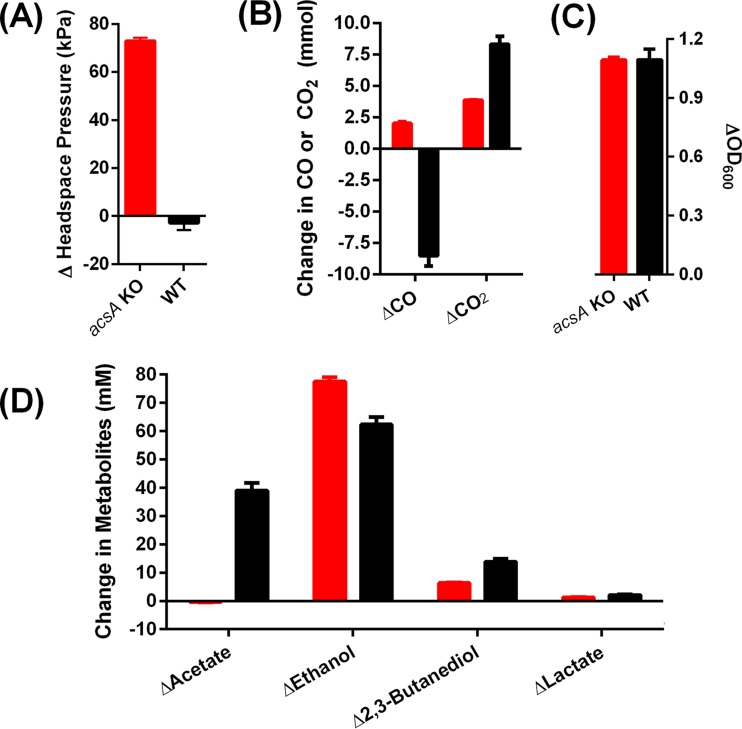
FIG 4 .
Changes in biomass, headspace, and metabolite levels between the start and finish of a mixotrophic-growth experiment with the acsA KO and WT strains on 10 g/liter fructose and 200 kPa CO. Panels: A, change in headspace pressure; B, change in headspace CO or CO2; C, change in growth based on OD600; D, change in metabolites. Columns: red, acsA KO strain; black, WT. n = 3. Error bars show the standard error of the mean.

