
Figure 5.
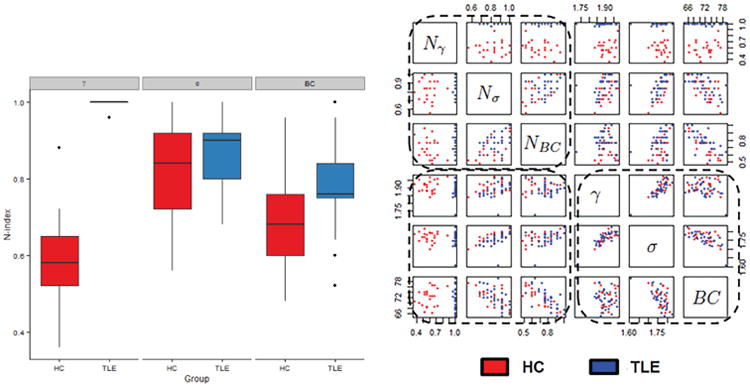
(a) Boxplots showing the estimated N-index for clustering coefficient (γ), small-world index (σ), and betweenness centrality (BC) for healthy controls and TLE patients. (b) Scatterplots showing the separation of pathological states based on the graph metric alone (bottom right panel); N-index alone (upper left panel); and combination of the N-index and graph metric (bottom left panel). We note that when temporal dynamics are considered as an additional feature, the pathological states exhibit much greater separability.