
Figure 3.
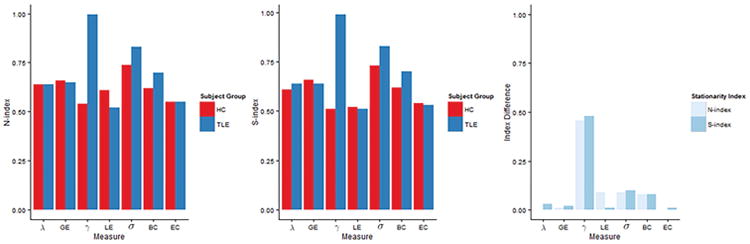
Temporal stationarity of graph metrics of (a) healthy controls and TLE patients using N-index and (b) healthy controls and TLE patients using S-index. In (c), magnitude of differences in temporal stationarity between healthy controls and TLE patients for the various graph metrics are shown.