Figure 2.
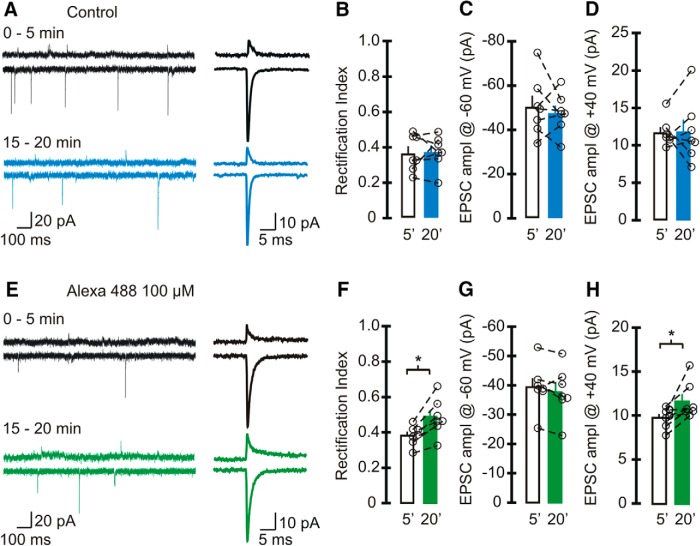
Alexa 488 increased the rectification index of sEPSCs in stellate cells. A–D, Spontaneous EPSCs were recorded using a pipette solution that did not contain any Alexa Fluor dye (control). A, Left, Example traces of sEPSCs recorded at +40 mV (top) and −60 mV (bottom) at 0–5 min (black trace) and after 15–20 min of recording (blue trace). Right, Average synaptic currents. B–D, Average and individual RIs of sEPSCs (B) and amplitude at −60 mV (C), and +40 mV (D) in control cells with an initial RI < 0.5 (n = 7 cells, 6 animals). Neither the RI nor the amplitude of EPSCs changed within 20 min of recording. E–H, Spontaneous EPSCs were recorded using a pipette solution that included 100 µm Alexa Fluor 488. E, Left, Example traces of sEPSCs recorded with Alexa 488 in the recording electrode (black traces, 0–5 min; green traces, 15–20 min). Right, Average EPSCs. F, RI increased after 15–20 min of recording (paired t test, n = 7 cells, 6 animals, p < 0.004). G, EPSC amplitude at −60 mV did not change with time. H, The amplitude of synaptic currents at +40 mV (paired t test, p = 0.025). Bar graphs represent the average, and open circles represent individual values.

