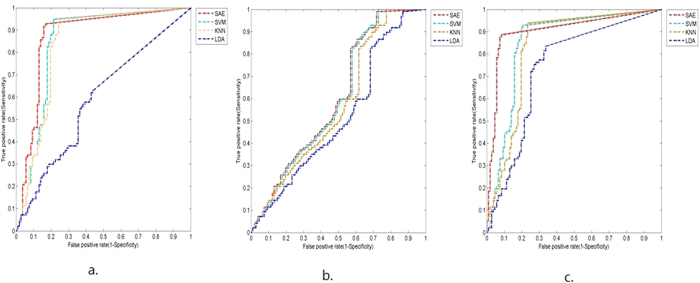
Figure 5. ROC curves comparing the discriminative performances of the four classification models.
The three scenarios show the ROC curves based on the following classifications: (a) Microcalcifications alone (15 segmentation features). (b) Breast masses alone (26 segmentation features). (c) Microcalcifications plus breast masses (41 segmentation features).

