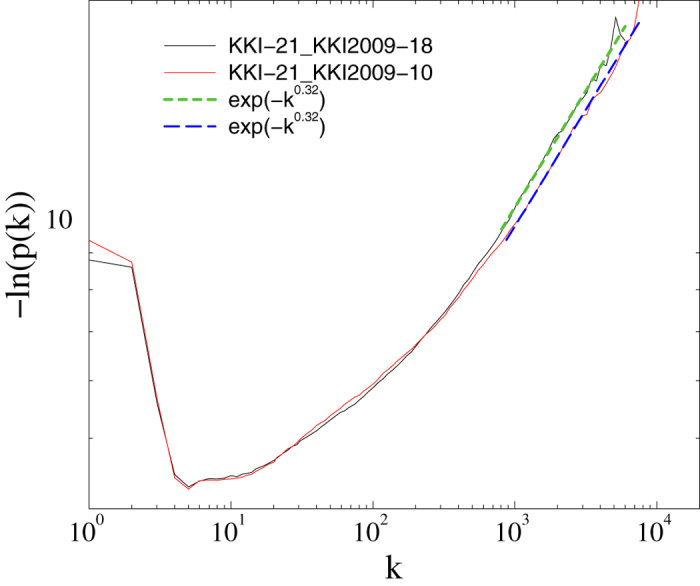
Figure 1. Empirical degree distributions of the KKI-10 and KKI-18 graphs (solid lines).

Dashed lines show a rough-and-ready approach: ordinary least-squares fits for k > 1000 for the two graphs (short-dashed line for fit to KKI-18, long-dashed line for KKI-10) suggest stretched exponential tails. While ordinary least-squares fits are not a sound basis for model selection, we demonstrate in this article that there is indeed statistical evidence in favor of a generalized three-parameter Weibull distribution with a stretched exponential tail.
