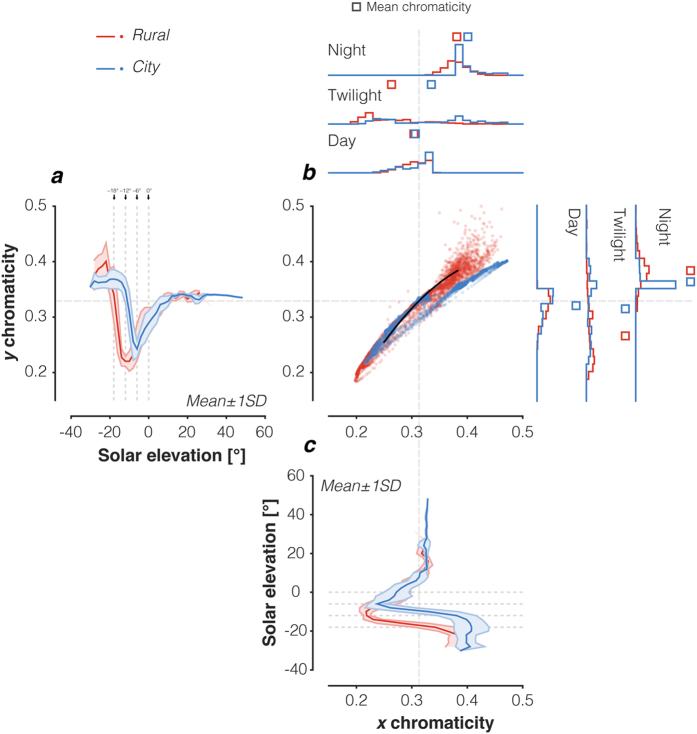
Figure 3. Chromaticity changes in the downwelling illumination as a function of solar elevation.
(a) Illumination CIE 1931 y chromaticity as a function of solar elevation. Vertical lines indicate transition zones between night, astronomical twilight, nautical twilight, civil twilight, and day. The y axis is shared with panel b. Data were averaged in 2° bins. (b) Scatter plot of individual chromaticity data for each measured spectrum. The black line indicates the chromaticity along the daylight locus produced by calculating the chromaticity of CIE daylight spectral power distributions with correlated colour temperatures between 4000 K and 25,000 K. Grey cross-hair line indicates the chromaticity of CIE standard illuminant D65 (6500 K). Histograms at the top show the distributions of CIE x chromaticity for the daylight, twilight and night regimes, with the x axis shared with panel b. Histograms to the right show the distributions of CIE y chromaticity for the daylight, twilight and night regimes, with the y axis shared with panel b. Squares indicate the mean x and y chromaticities, respectively, within the respective regime. (c) Illumination CIE 1931 x chromaticity as a function of solar elevation. Horizontal lines indicate transition zones between night, astronomical twilight, nautical twilight, civil twilight, and daylight. The x axis shared with panel b. Data were averaged in 2° bins.

