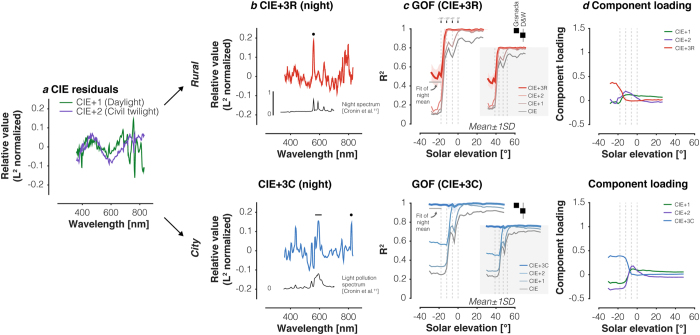
Figure 6. Extending the CIE daylight model to twilight and night illumination.
(a) Mean residuals of CIE fit for daylight and civil twilight in both Rural and City location. Residuals were normalised by their vector length. (b) Mean residuals after fitting the CIE Model along with the daylight and civil twilight residuals (CIE + 2 model) to the astronomical twilight data from the rural location (upper panel) and the City location (lower panel). Residuals were normalised by their vector length. Inset in the upper panel shows the normalised night spectrum measured in Zabriskie Point, CA by Cronin, et al.1. Inset in the lower panel shows the normalised night spectrum measured in Boston, MA by Cronin, et al.1. Note the correspondence of relative spectral peaks between the residuals and the night spectra measured by Cronin, et al.1. In the upper panel, black dot indicates 558 nm. In the lower panel, black dot indicates 819 nm; black line indicates 570–615 nm. (c) Goodness-of-fit of the full CIE + 3R model in the Rural location (upper panel) and the CIE + 3C model the City location (lower panel). Vertical lines indicate transition zones between night, astronomical twilight, nautical twilight, civil twilight, and day. Goodness-of-fit values were averaged in 5° bins of solar elevation. Insets in upper and lower panels show goodness-of-fit for the CIE model (same as Fig. 5b,d), and CIE + 1, CIE + 2 and final CIE + 3R and CIE + 3C models. (d) Component loadings of the additional three basis functions for the Rural and the City location. Vert ical lines indicate transition zones between night, astronomical twilight, nautical twilight, civil twilight, and day. Component loadings and goodness-of-fit values were averaged in 2° bins of solar elevation. The CIE, CIE + 1, CIE + 2 and final CIE + 3R and CIE + 3C models were fit in the 360–830 nm range to the spectra in this dataset, and in the 380–780 nm range for Granada and DiCarlo & Wandell3 datasets. R2 were calculated in these ranges, respectively.

