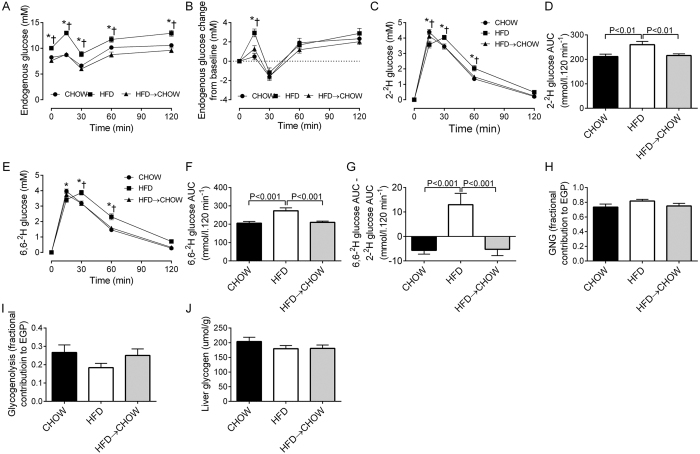
Figure 3. Effects of diet on endogenous glucose, glucose disposal and sources of EGP.
Endogenous glucose levels (A), the pattern of endogenous glucose production (B), disposal of 2-2H glucose (C,D) and 6,6-2H glucose (E,F) and hepatic futile glucose cycling (G) during the stable isotope labelled OGTT. The fractional contribution of GNG (H), and glycogenolysis (I) to EGP and liver glycogen (J) following a 5 h fast. Data are mean ± SEM. N = 20 per group. *HFD vs. CHOW, P < 0.05; †HFD → CHOW vs. CHOW, P < 0.05.

