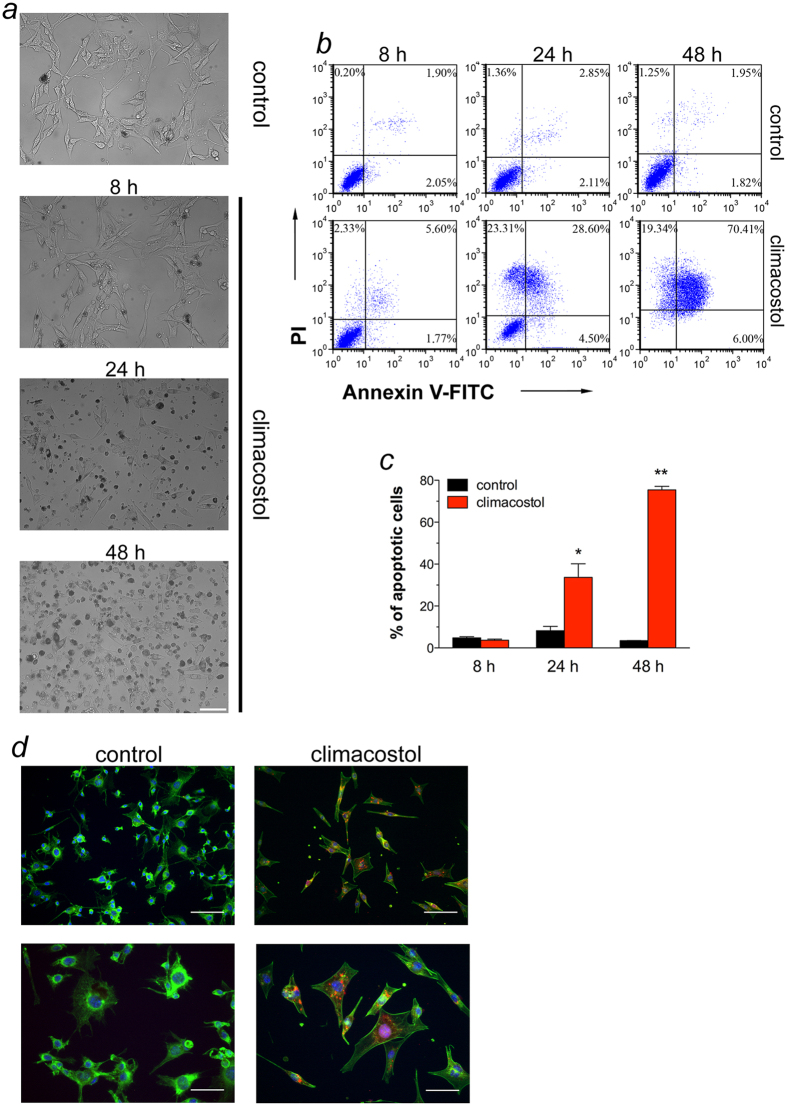
Figure 3. Apoptosis in melanoma cells treated with climacostol.
(a–c) B16-F10 cells were cultured in the presence of 30 μg/ml climacostol or vehicle (control) for 8, 24 or 48 h. (a) Phase-contrast microscopy. The images are representative of 3 independent experiments. Scale bar: 50 μm. (b) Evaluation by flow cytometry of Annexin V/PI staining. Quadrants are drawn, and relative proportion of dying cells is indicated. The events shown in the lower left-hand quadrant are unlabeled cells. Images and data are representative of 3–7 independent experiments. (c) Percentage of apoptotic cells (Annexin V+/PI− + Annexin V+/PI+ fraction; the Annexin V−/PI+ fraction, regarded as necrotic stage, was excluded) for experiments shown in (b). *p < 0.001 and **p < 0.0001 vs the respective control. (d) Immunofluorescence imaging of cleaved Caspase 3 (punctate red pattern) in B16-F10 cells cultured in the presence of 30 μg/ml climacostol or vehicle (control) for 24 h. DAPI (blue) and phalloidin (green) were used for nuclei and cytoskeleton detection, respectively. The images are representative of 3 independent experiments. Upper panels: 100 μm scale bar; lower panels: 50 μm scale bar.

