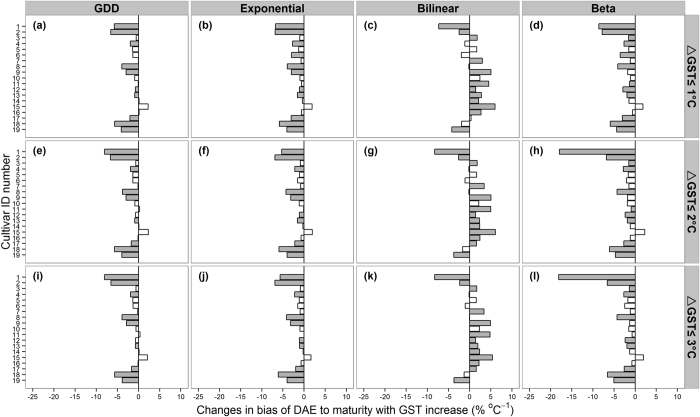
Figure 5. Changes in bias of DAE to maturity with increasing GST per cultivar for each of the four phenology models (upper x-axis) and three calibration experiments (right y-axis).
The cultivar ID numbers are presented in Table 1. Grey bars indicate statistically significant bias in yield simulation with GST increase (P < 0.05), and white bars indicate insignificant bias (P > 0.05).

