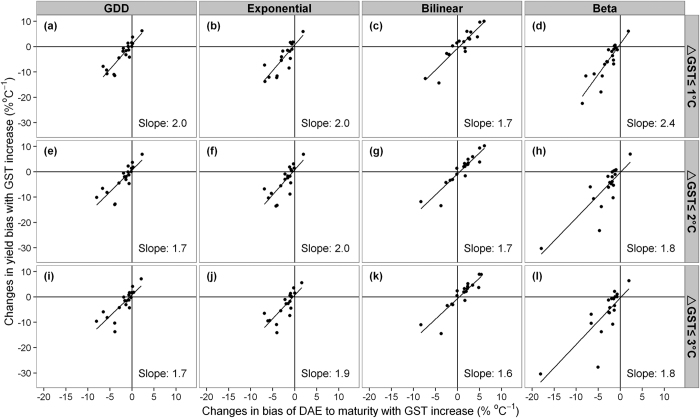
Figure 7. Relation between yield bias and DAE to maturity bias with increasing GST for each of the four phenology models (upper x-axis) and three calibration experiments (right y-axis).
Each dot represents a cultivar and the line indicates the ratio of yield bias to phenology bias over all 19 cultivars.

