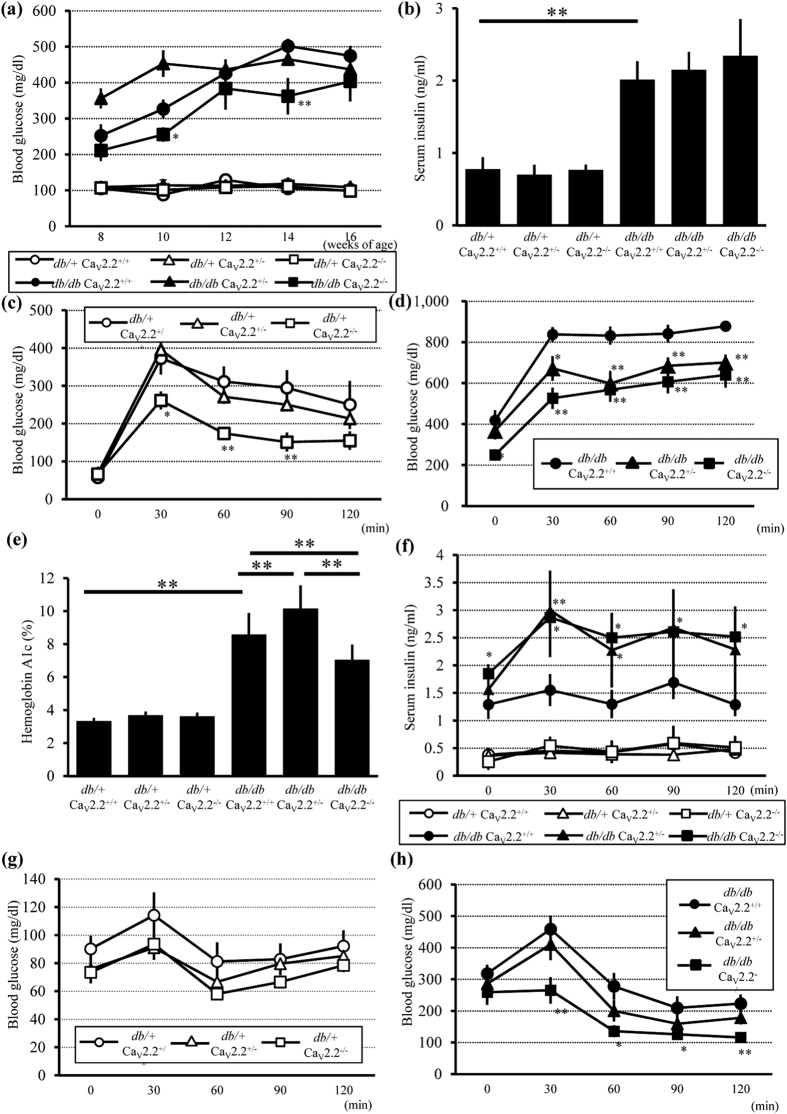
Figure 2. Blood glucose, serum insulin, and the results of GTTs and ITTs in db/+ and db/db mice.
(a) Time course of 6-h fasting blood glucose concentrations. db/db Cav2.2−/− mice had lower levels of blood glucose than db/db Cav2.2+/+ mice. (b) Serum insulin levels at 16 weeks of age. There were no different among db/db mice groups. (c) IPGTTs (2 g/kgBW) of db/+ mice at 15 weeks of age. db/+ Cav2.2−/− mice showed better glucose tolerance compared with db/+ Cav2.2+/+ mice. (d) IPGTTs (1 g/kgBW) of db/db Cav2.2−/− mice at 15weeks of age. db/db Cav2.2−/− mice exhibited significantly reduced levels of blood glucose compared with db/db Cav2.2+/+ mice. Since the glucometer has a detection limit up to 999 mg/dL, values above the detection limit were treated as 1000 mg/dL. (e) Hemoglobin A1c levels at 16 weeks of age. (f) Serum insulin levels of IPGTTs. The insulin levels in db/db Cav2.2−/− mice was significantly higher than these of db/db Cav2.2+/+ mice. db/+ Cav2.2+/+ mice (n = 6, white circles), db/+ Cav2.2+/− mice (n = 9, white triangles), db/+ Cav2.2−/− mice (n = 7, white squares), db/db Cav2.2+/+ mice (n = 7, black circles), db/db Cav2.2+/− mice (n = 7, black triangles), and db/db Cav2.2−/− mice (n = 8, black squares) for GTT. (g,h) Blood glucose levels in ITTs at 15 weeks of age of db/+ (g) and db/db (h) mice. db/+ Cav2.2+/+ mice (n = 5, white circles), db/+ Cav2.2+/− mice (n = 9, white triangles), db/+ Cav2.2−/− mice (n = 7, white squares), db/db Cav2.2+/+ mice (n = 9, black circles), db/db Cav2.2+/− mice (n = 9, black triangles), and db/db Cav2.2−/− mice (n = 7, black squares) for ITT. *p < 0.05, **p < 0.01 compared with Cav2.2+/+ mice of the same db genotype.

