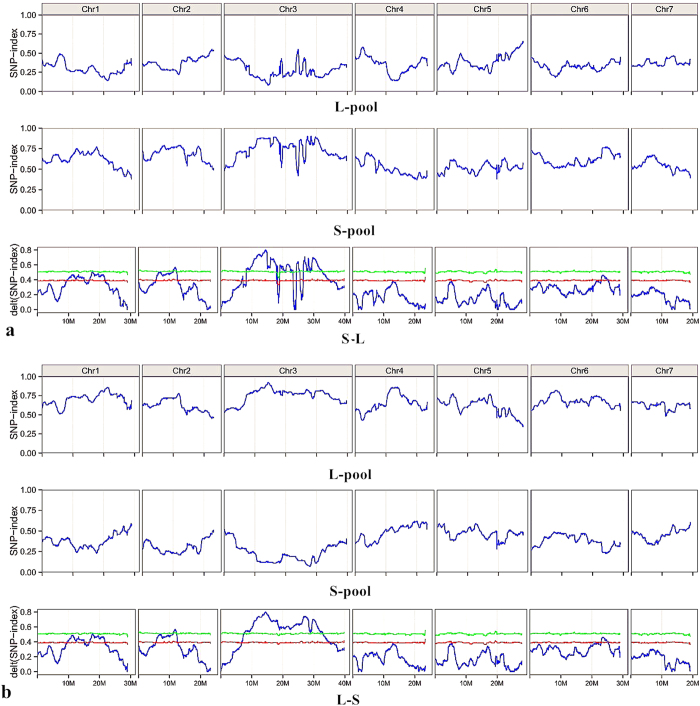
Figure 3. SNP-index graphs of L-pool, S-pool and Δ (SNP-index) graphs from QTL-seq analysis.
The Δ (SNP-index) plot with statistical confidence intervals under the null hypothesis of no QTL (green, P < 0.01; red, P < 0.05). The X-axis represents the position of seven chromosomes, and the Y-axis represents the SNP-index. The SNP-index was calculated based on a 1 Mb interval with a 10 kb sliding window. a: using CC3 genome sequence as the reference genome; b: using NC76 genome sequence as the reference genome.

