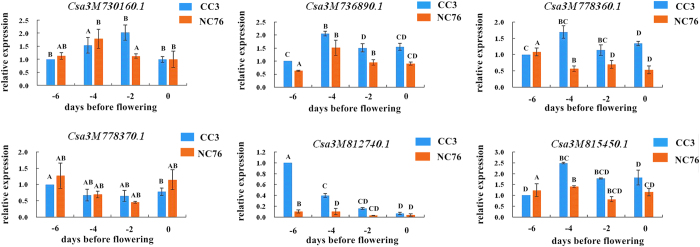
Figure 6. qRT-PCR results of six candidate genes localized in chromosome regions of the consensus QTL FL3.2.
The blue bars represent CC3, and the red bars represent NC76; The X-axis indicates 0, 2, 4, 6 days before anthesis, whereas the Y-axis indicates expression levels. The alphabets (A–D) represent significant levels of gene expression.

