
Figure 3. Whole-genome scan for selective sweeps.
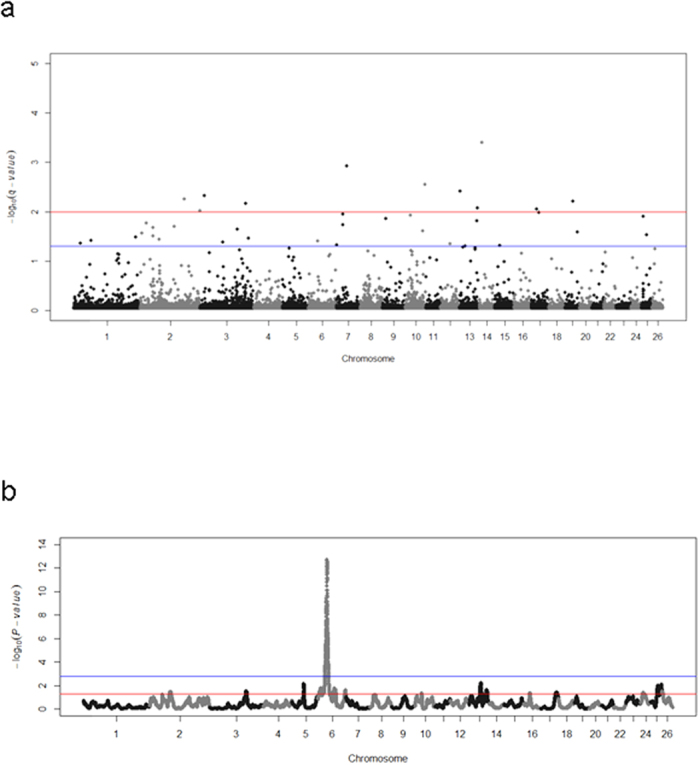
The two analyses were based on either the FST-outlier method implemented in BayeScan (a) or the hapFLK statistic (b). In the BayeScan analysis, the red and blue lines indicate the thresholds of significance set at 0.05 and 0.01 after correction for multiple testing (q-values), respectively. In the hapFLK analysis, the red and blue lines indicate the thresholds of significance set at 0.05 before (nominal P-value) and after (q-value) correction for multiple testing, respectively. Genomic coordinates and statistical significance (−log10 P-values) are plotted in the x- and y-axis, respectively.