
Figure 4. A detailed view of the putative selective sweeps on Oar3, Oar6 and Oar13 detected with the HapFLK statistic and confirmed with BayeScan.
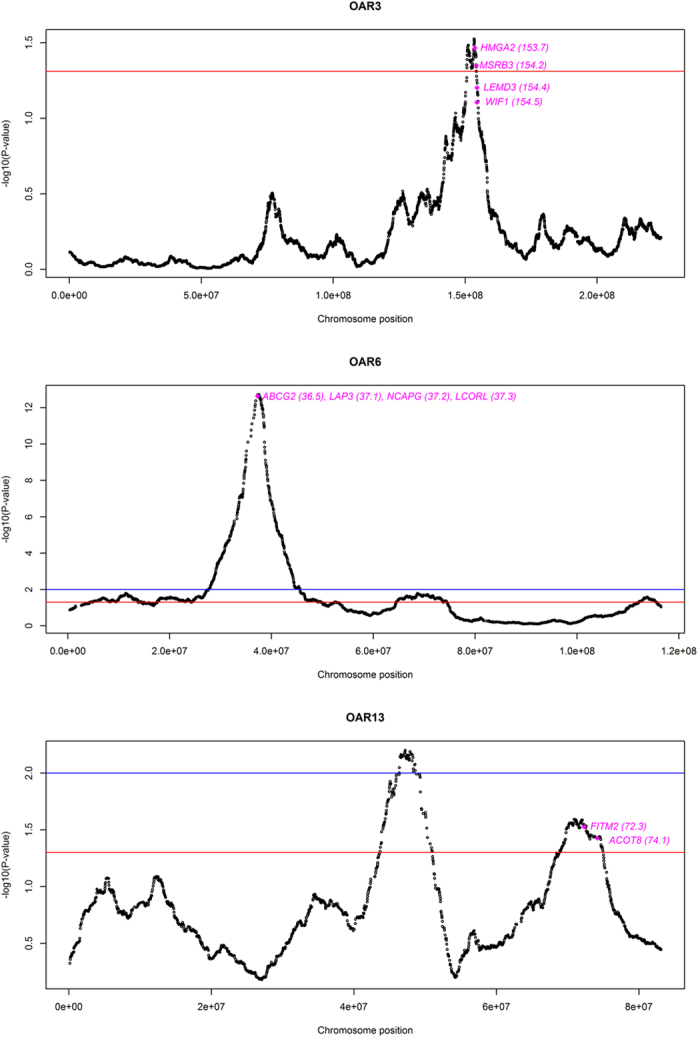
The red and blue lines indicate the thresholds of significance set at 0.05 before (nominal P-value) and after (q-value) correction for multiple testing, respectively. Genomic coordinates and statistical significance (−log10 P-values) are plotted in the x- and y-axis, respectively. The approximate location of the candidate genes discussed in the current work is indicated (in Mb).