
Figure 9.
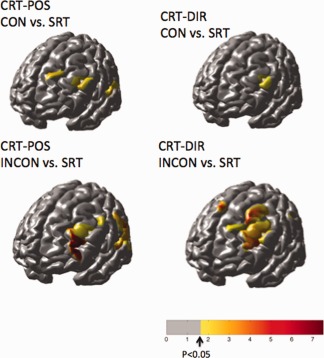
The effects maps above show regions that were more active in the CRT condition compared to the SRT conditions for oxyhemoglobin. The congruent (top) and incongruent (bottom) tasks are shown for the steps following positional and directional cues of the CRT task. Only the right‐step data are shown.