
Figure 10.
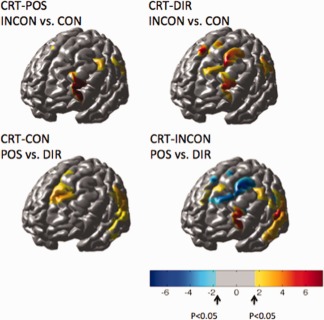
The top row of images shows regions more active during the incongruent trials compared to the congruent trials for the right‐step trials. The bottom row of images shows the comparison of activations based on the position versus the direction of the arrow cue. All images show the effects map for the oxyhemoglobin changes. Red indicates areas more active in the incongruent condition compared to the congruent condition (top row) or more active in tasks following a positional cue compared to a directional cue (bottom row). Blue indicates areas more active in the directional cues compared to the positional cues. No areas were statistically more active in the congruent conditions compared to the incongruent condition.