
Fig. 6.
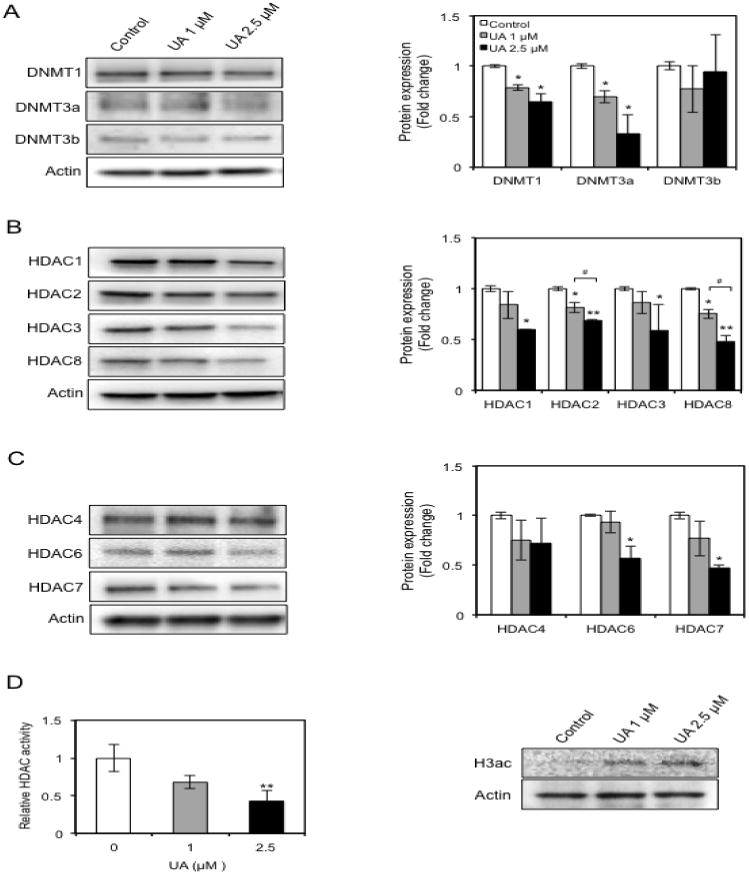
UA decreases the expression of DNMTs (A), Class I and II HDACs (B & C), inhibits HDAC activity, and increases H3ac levels (D) in JB6 P+ cells. The cells were treated with the indicated concentration of UA for 3 days, and the total cell lysates and nuclear proteins were harvested at the end of the treatment. Total protein (25 μg per lane) was separated by SDS-PAGE, and the levels of each protein of interest were determined by Western blot analysis. The isolated nuclear extracts from each group were used to determine total HDAC activity. The protein amounts in Western blot analysis were normalized to the levels of β-actin and data are expressed as the relative fold change compared with the control. The values are the mean ± SD of three independent experiments. The figure H3ac is a representative of three individual experiments. *p < 0.05 and **p < 0.001 vs control. #p < 0.05 vs UA 1 μM.