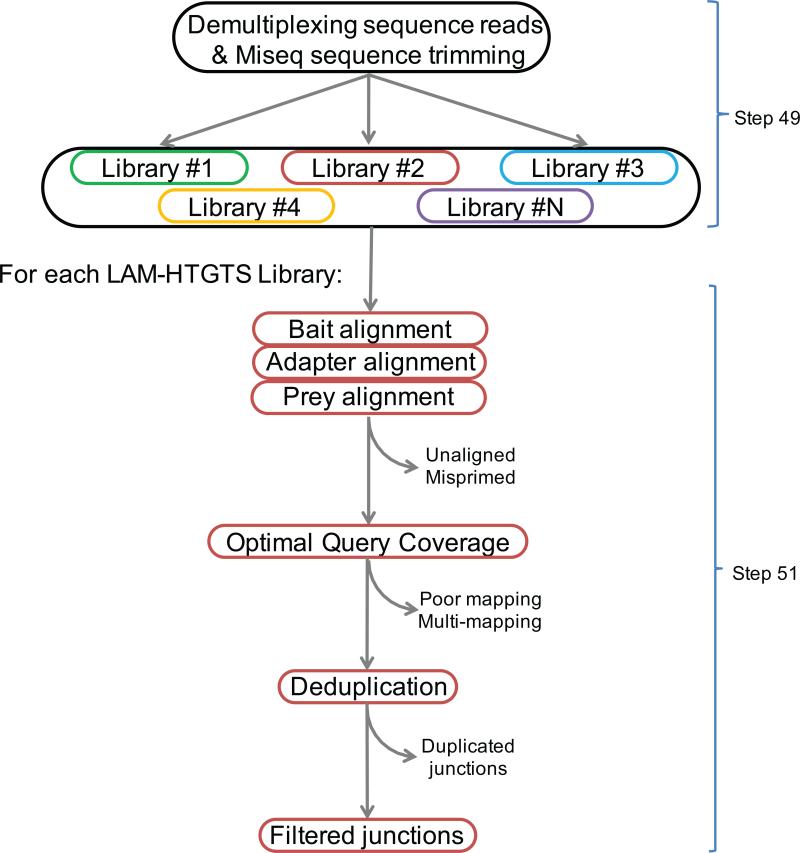
Figure 3. Flow chart of bioinformatic pipeline for translocation junction identification.
Multiple HTGTS libraries with different barcodes can be sequenced in the same Miseq flow cell. De-multiplexing separates sequencing reads for each library, followed by sequence read processing which takes into account bait, prey, and adapter alignments to optimally define the sequence read. Uniquely mapped bait-prey junctions are retained as filtered junctions while identical junctions are separated.

