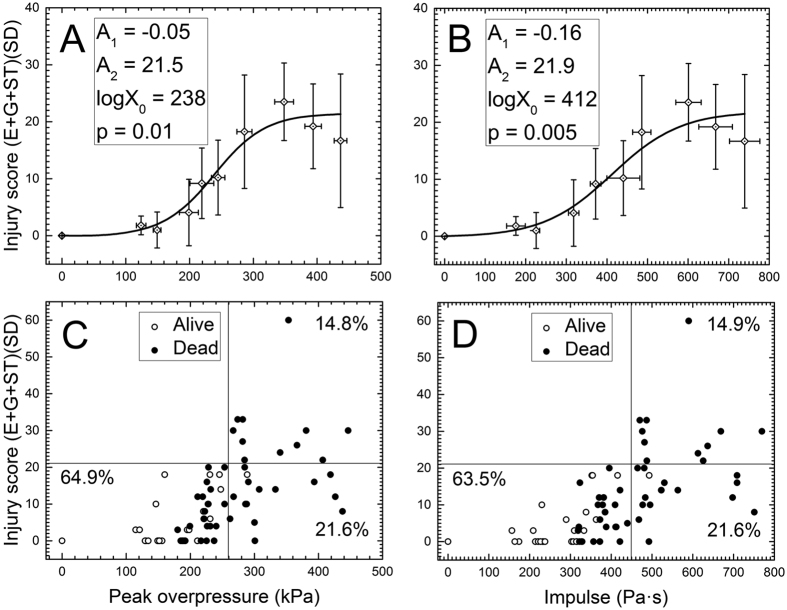
Figure 3. Lung injury scores for rats exposed to a single blast.
The dose-response model was used to fit the IS as a function of peak overpressure (A,C) and impulse (B,D). The scattergrams (C,D) illustrate individual scores and their distribution among the cohort of 75 rats evaluated in this test. The value of 21 is the upper limit of the slight lung injury level as defined by Yelverton53. The vertical lines (peak overpressure of 260 kPa (C) or impulse of 450 Pa·s (D)) correspond to 50% predicted mortality rate according to the dose-response model in Fig. 2. There are six animals which died after the blast and had no apparent lung injuries (score of zero).

