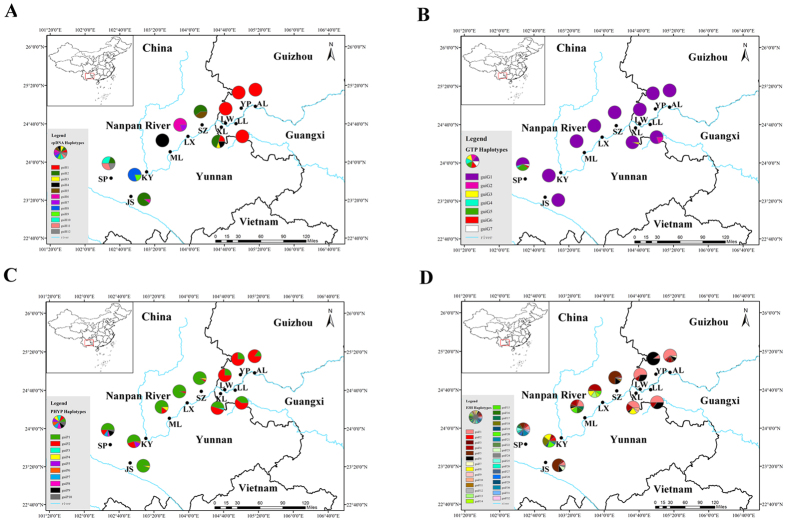
Figure 1.
Geographical distribution of 11 populations of C. guizhouensis and distribution of its haplotypes detected from cpDNA (A), GTP (B), PHYP (C) and F3H (D). Population codes refer to Table S1. Maps were drawn using the software ArcGIS version 10.2 (http://desktop.arcgis.com) and modified using Photoshop (Adobe Corporation, California, America).

