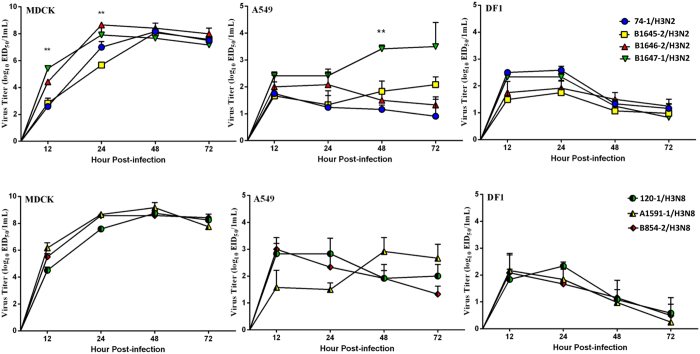
Figure 1. Growth properties of the H3 viruses in MDCK, A549 and DF-1 cells.
The cells were infected with each virus at an MOI of 0.01. Each point on the curve indicates the mean from three independent experiments, and error bars indicates the standard errors of the mean (SEM) (*P < 0.05; **P < 0.01).

