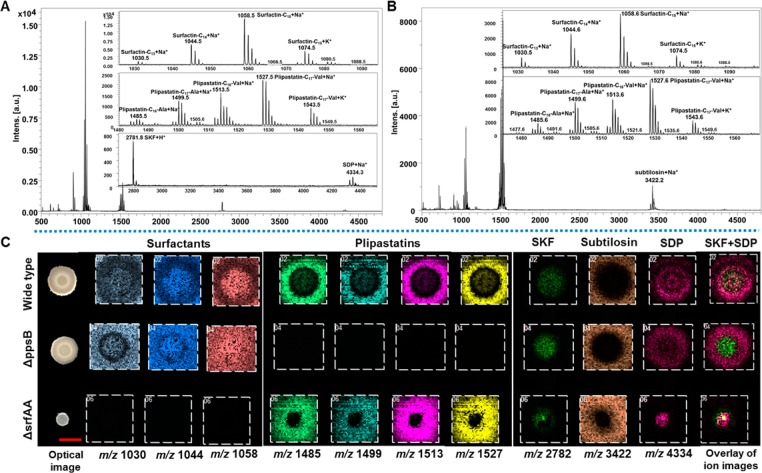
Figure 1.
MALDI imaging analysis of colony biofilms of B. subtilis NCIB3610 and its mutants. (A,B) Single-pixel MALDI-MS spectra of surfactins, plipastatins, subtilosin, SKF and SDP from the inner (A) and outside (B) regions of B. subtilis NCIB3610 biofilms. (C) Selected MALDI images for B. subtilis biofilms. Each column represents (left to right): m/z 1030 (surfactin-C13, [M + Na]+); m/z 1044 (surfactin-C14, [M + Na]+); m/z 1058 (surfactin-C15, [M + Na]+); m/z 1485 (plipastatin-C16-Ala, [M + Na]+); m/z 1499 (plipastatin-C17-Ala, [M + Na]+); m/z 1513 (plipastatin-C16-Val, [M + Na]+); m/z 1527 (plipastatin-C17-Val, [M + Na]+); m/z 2782 (SKF, [M + H]+); m/z 3422 (subtilosin, [M + Na]+); m/z 4334 (SDP, [M + Na]+); and an overlay of ion images (green: SKF; bright pink: SDP). The ion intensity is reflected by the intensity of colors. Each column of ions is displayed using the same intensity scale, optimized per each metabolite and normalized to the TIC. Scale bar = 5 mm.

