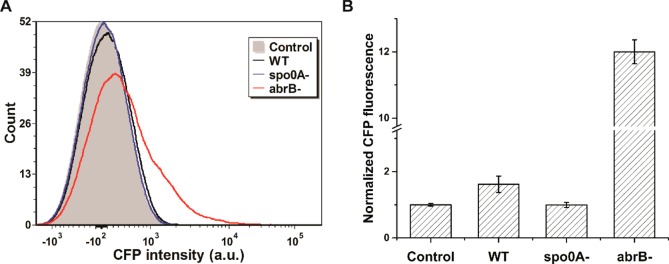
Figure 2.
Flow cytometric analysis of B. subtilis colony biofilms with the PyqxM-CFP reporter. B. subtilis strains were cultured on MSgg agar media for 24 h before harvest. Colony biofilms were dispersed into single cells using sonication for analysis via flow cytometry. Control denotes the NCIB3610 strain without the reporter. WT denotes the NCIB3610 strain integrated with a PyqxM-CFP cassette. Two gene deletion strains based on WT are denoted as spo0A- and abrB-. (A) Histogram of the flow cytometry. (B) Mean fluorescence intensities of 10 000 cells. CFP intensities were normalized to the control. Error bars indicate the SDs of three biological replicates. P values were calculated using the independent two-tailed, two-sample t-test for equal sample sizes and equal variance: 0.042 (WT/Control), 0.944 (spo0A-/Control), and 0.013 (abrB-/Control).

