Fig. 2.

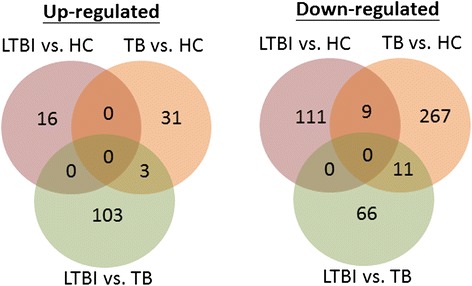
Number of differentially expressed genes among TB, LTBI, and healthy control (HC) group. Significant differential expression is represented by an absolute log2 fold change ≥1, FDR < 0.05

Number of differentially expressed genes among TB, LTBI, and healthy control (HC) group. Significant differential expression is represented by an absolute log2 fold change ≥1, FDR < 0.05