
Fig. 5.
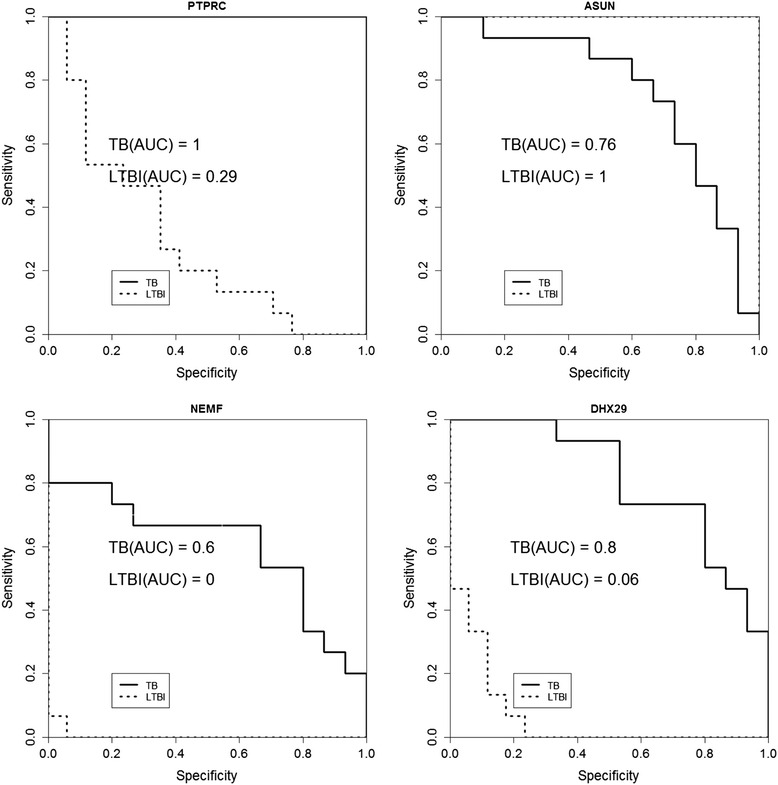
ROC analysis of four differentially expressed genes among TB, LTBI, and healthy controls (HC). AUC represents the area under the curve
Official websites use .gov
A
.gov website belongs to an official
government organization in the United States.
Secure .gov websites use HTTPS
A lock (
) or https:// means you've safely
connected to the .gov website. Share sensitive
information only on official, secure websites.
ROC analysis of four differentially expressed genes among TB, LTBI, and healthy controls (HC). AUC represents the area under the curve