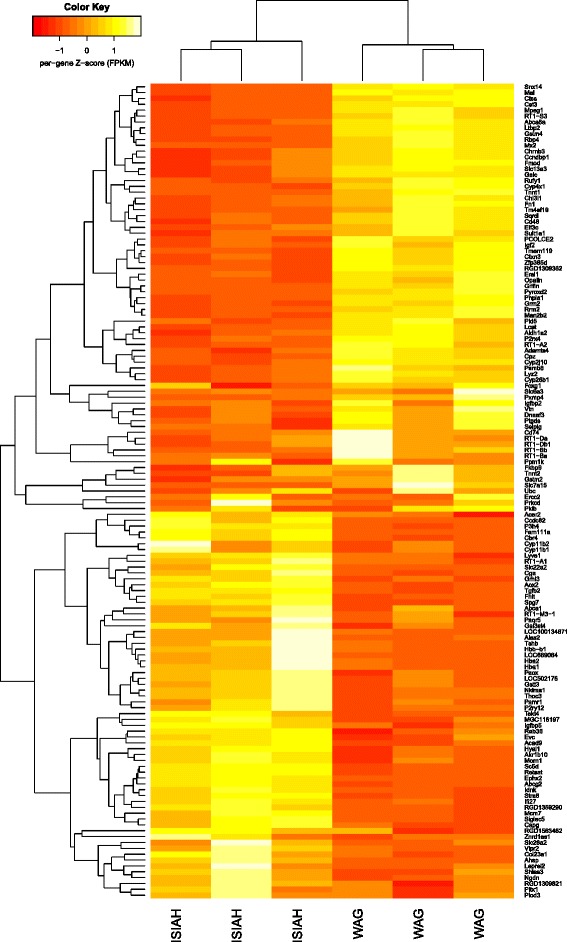
Fig. 1.

Heatmap of the differentially expressed genes in the hypothalami of the ISIAH and WAG rats. Dendrograms were constructed using hierarchical ‘complete linkage’ clustering by Euclidean distance. Yellow depicts genes that were up-regulated in a sample, and red depicts those that were down-regulated
