
Fig. 1.
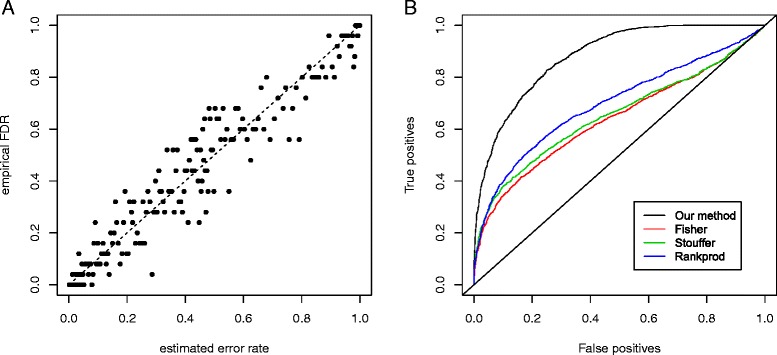
Calibration and comparison of discriminative power in the simulation with violation of model assumption. a. The estimated error rate is compared with the empirical FDR for the simulation setting S1. Results from other simulation settings are similar (Additional file 1: Figure S1). b. The percentage of correct and incorrect calls at various thresholds for our method, Fisher’s method, Stouffer’s method and RankProd, for the simulation setting S1. Results from other simulation settings are similar (Additional file 1: Figure S2)