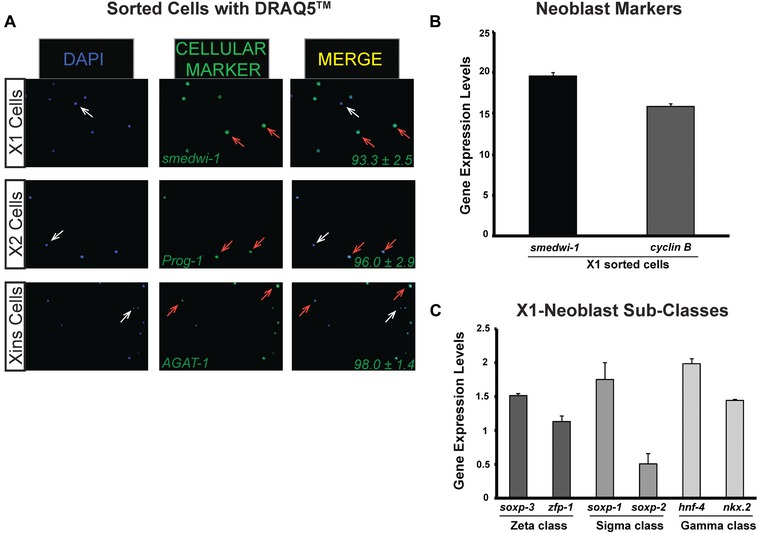
Figure 4.

Cellular subpopulations isolated with DRAQ5 staining express neoblast and post‐mitotic markers. Planarian single cell suspension samples were obtained from five whole planarians and stained as described. (A) Fluorescent in situ hybridization using probes specific for X1, X2, and Xins cell populations. Cell nuclei were stained with DAPI (blue signal) and fluorescent anti‐sense probes (green signal) smedwi‐1 (X1), Prog‐1 (X2), and AGAT‐1 (Xins). Arrows indicate either cells expressing the respective gene (orange) or cells that do not express the gene (white). The percentage of cells expressing each gene is represented at the bottom right corner of the respective merge image. Values represent the mean ± SD of three different samples obtained from the sorting of 10 dissociated planarians. (B), (C) Gene expression levels determined with qPCR using RNA extracted from X1 cells using neoblast specific probes and neoblast subclasses. qPCR analyses are from triplicate experiments; values represent the mean ± SD. Gene expressions are relative to the ubiquitously expressed clone H.55.12e.
