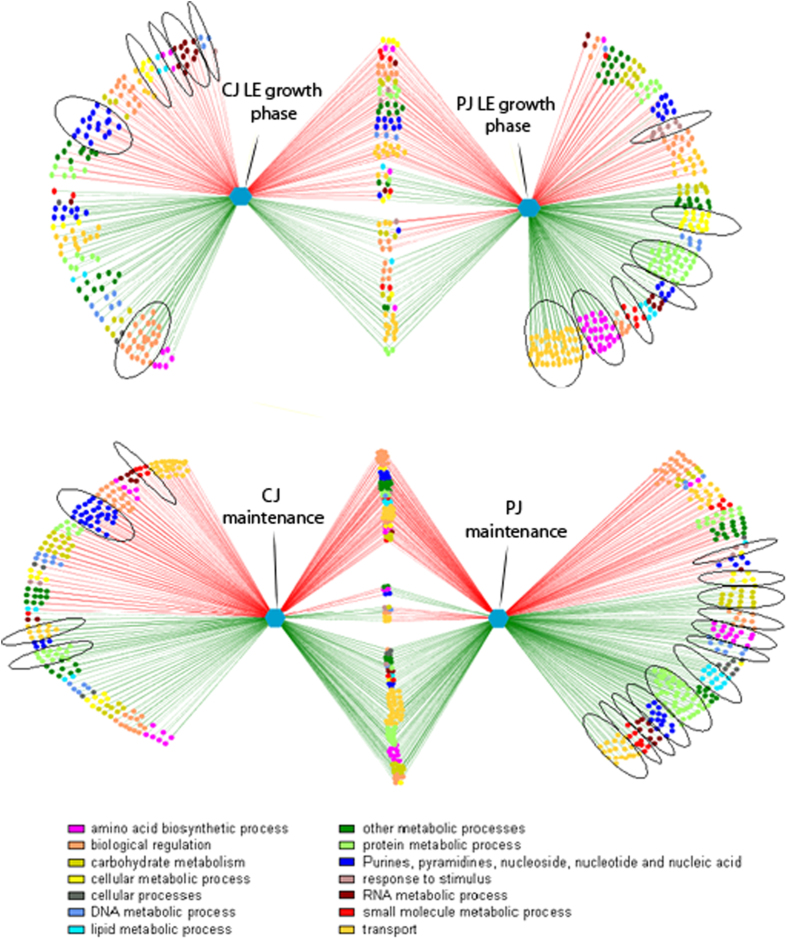
Figure 3.
Significantly differentially transcribed genes in Lactobacillus plantarum C2 at the late exponential growth phase (16–18 h at 30 °C) (A) and during the maintenance period (21 days at 4 °C) (B) in carrot juice (left) and pineapple juice (right) compared with MRS medium. The green and red lines indicate up- and down-regulated genes, respectively. The Cytoscape software was used to construct the networks. Each node in the network represents a gene. Edges are coloured according to the up- or down-regulation of the genes; nodes are coloured according to the parent Gene Ontology (GO) term. Significant GO terms with at least 60% of genes having p-values less than 0.05 are circled. Genes from both comparisons (common genes) are not circled, because they were already considered in calculating p-values within individual comparisons.

