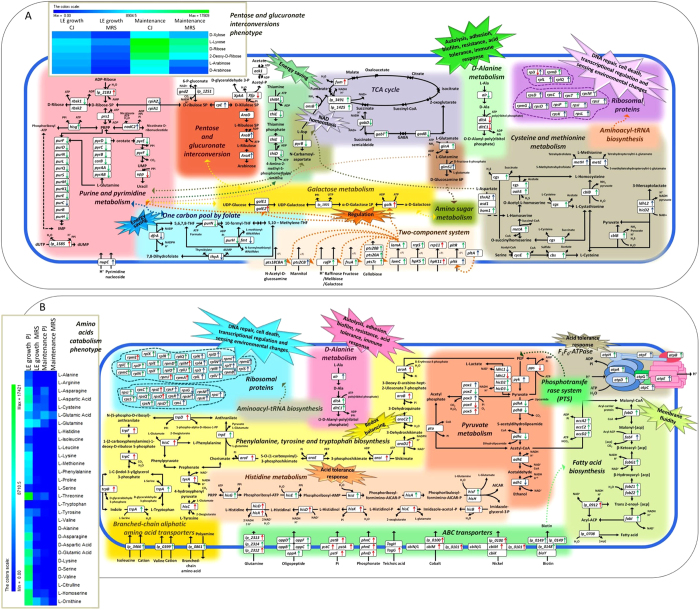
Figure 7.
Integrated view of the metabolic pathways affected by transcriptional changes in Lactobacillus plantarum C2 during growth and maintenance in carrot (A) and pineapple (B) juices. Up- and down-regulated genes are indicated by upward and downward pointing arrows, respectively. Red arrows indicate regulation during the late exponential growth phase. Blue arrows indicate regulation during the maintenance period. Green arrows indicate regulation during both growth and maintenance. Correlations between phenotypes (Omnilog microarray) and transcriptional changes are also indicated.

