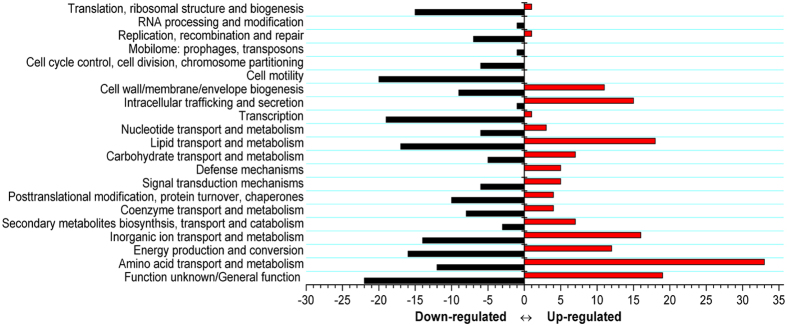
Figure 2. COG classifications of proteins with a fold change of at least 1.5.
COG classifications were constructed according to Pseudomonas chlororaphis HT66 project in the Integrated Microbial Genomes database (Project ID: Gp0042620). Red and black bars represent the numbers of upregulated and downregulated proteins, respectively.

