
Fig. 2.
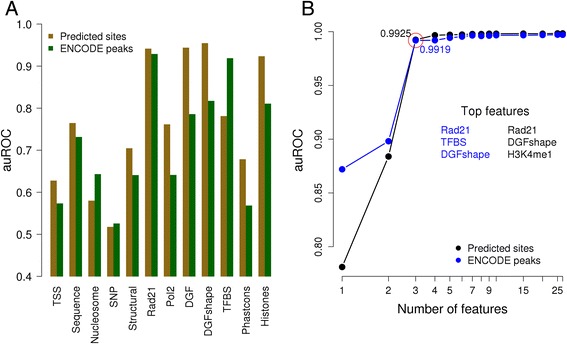
Classification results in genome wide predicted sites and ENCODE peak lists. The performance in classifying strong versus weak binding sites is reported as area under ROC curve. a Performance of individual feature or feature classes on CTCF sites (predicted sites and ENCODE peak lists) in K562 cell-line. b Feature importance assessed by recursive feature elimination (RFE-SVM)