
Fig. 5.
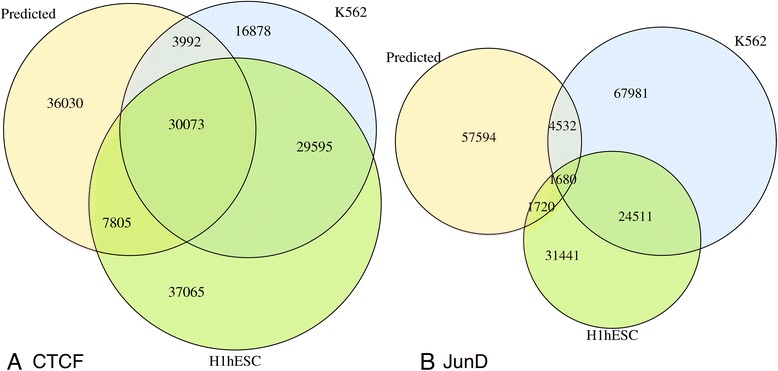
Overlap between predicted sites and ENCODE peaks. The Venn diagrams show the overlap between predicted TFBS lists and ENCODE peak lists for two cell types (K562 and H1hESC) for (a) CTCF and (b) JunD
Official websites use .gov
A
.gov website belongs to an official
government organization in the United States.
Secure .gov websites use HTTPS
A lock (
) or https:// means you've safely
connected to the .gov website. Share sensitive
information only on official, secure websites.
Overlap between predicted sites and ENCODE peaks. The Venn diagrams show the overlap between predicted TFBS lists and ENCODE peak lists for two cell types (K562 and H1hESC) for (a) CTCF and (b) JunD