
Fig. 6.
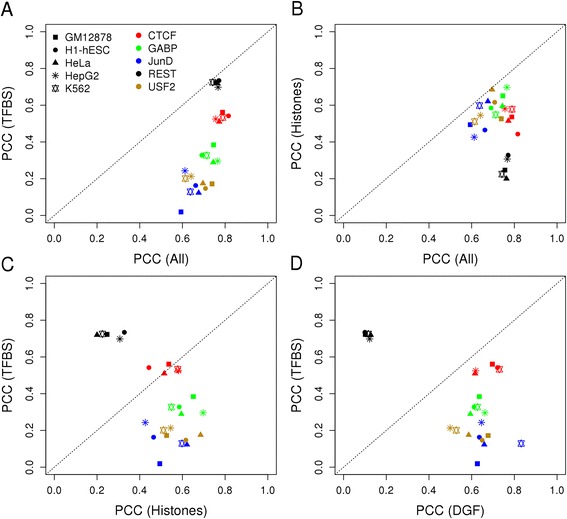
Regression of multiple factors in different cell lines. Each scatter plot compares the prediction accuracy of regression models (SVM) trained with two different feature sets. (a) TFBS vs all features, (b) histone marks vs all features, (c) TFBS vs histone marks and (d) TFBS vs DGF feature. “Histones” includes the following seven marks: H3K4me2, H3K4me3, H4K20me1, H3K9ac, H3K27ac, H3K27me3, H3K36me3