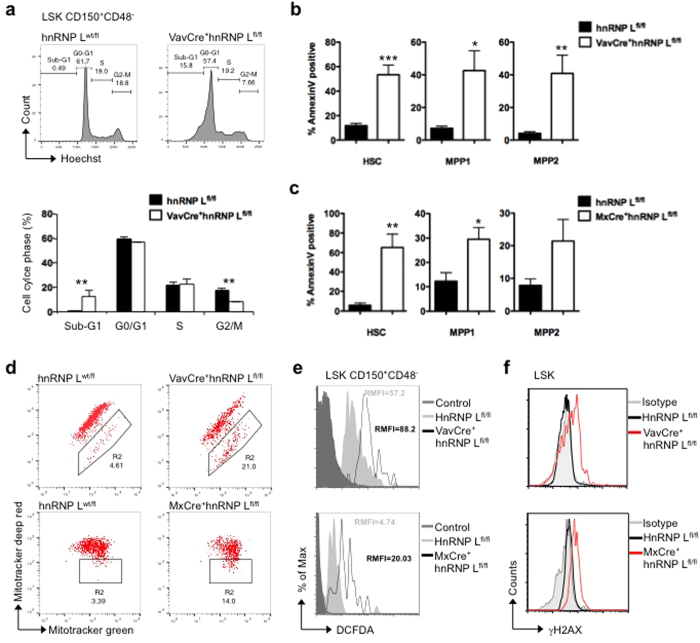
Figure 5. Apoptosis induced by hnRNP L deletion in HSCs and progenitor cells.
(a) HSCs (defined as LSK Flt3−, CD150+CD48−) from FL of animals with the indicated genotype were analyzed by Hoechst staining (upper panel). The percentages of cells in the different cell cycle phases are indicated by the gates in the histograms and the bar graph (lower panel). (n = 3). (b,c) Cell death was assessed by Annexin V staining in HSCs (defined as LSK Flt3−, CD150+CD48−), MPP1 (defined as LSK Flt3−, CD150+CD48+) and MPP2 (defined as LSK Flt3−, CD150−CD48−) from FL (b) or BM (c), (n = 6) All error bars are means ± SEM (*p < 0.01, **p < 0.001, ***p < 0.0001). (d) FL or BM cells with the indicated genotype stained with Mitotracker green (total mitochondria) and Mitotracker deep red (respiring mitochondria) for 30 min and analysed by flow cytometry. (e) Level of reactive oxygen species (ROS) was assessed by flow cytometry using DHFCA staining on gated HSCs after incubation for 30 min at 37 °C. (n = 3) (f) Level of double strand breaks was assessed by flow cytometry using antibody against γ-H2AX on gated LSK (Lin−Sca-1+cKit+) population from FL or BM. Gray filled, isotype control; black line, control and red line, hnRNP L deleted cells (n = 3).

