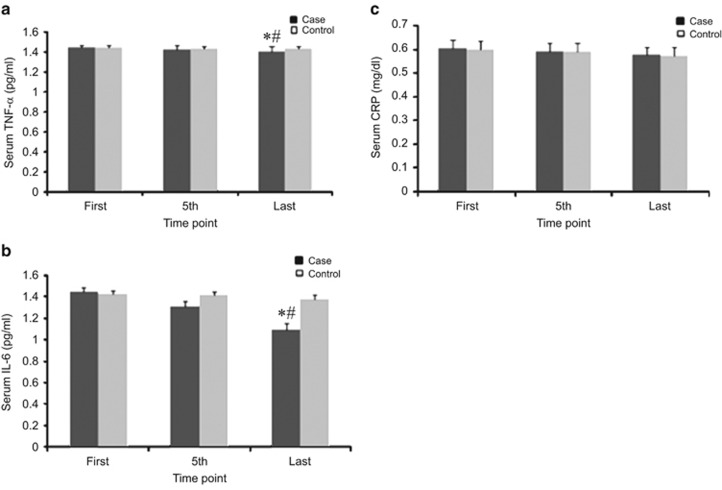
Figure 4.
Effects of EA treatment on inflammatory markers. (a) Serum TNF-α (pg ml−1). (b) Serum IL-6 (pg ml−1). (c) Serum CRP (mg dl−1). All data by ELISA. Data were expressed as means±s.d., *P<0.01 vs Control, #P<0.01 vs First. Time point: First: at the beginning of treatment, 5th: at the fifth time, last: at the last time of treatment.

