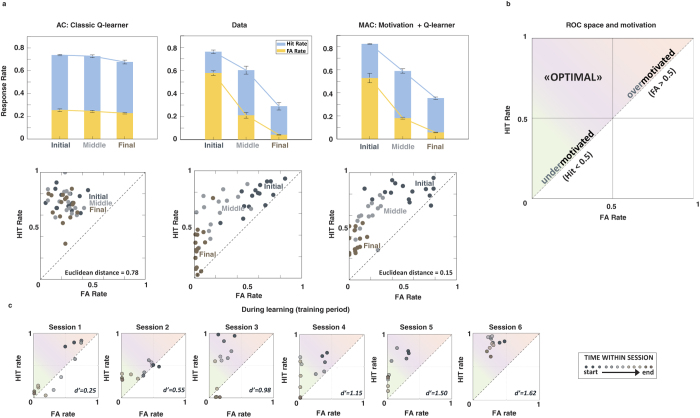
Figure 3. Introducing a motivation variable into the Actor-Critic (AC) model can account for our observations.
(a) Introducing a motivational factor into the classic Q-learner framework results in performance predictions similar to the changes we observed in the experimental results (Far right panel). Top: while the AC model showed relatively stable sensitivity throughout the entire session, the MAC model recreated the characteristic differences between HIT and FA rates. Bottom: HIT/FA pairs projected into ROC space demonstrate tight clustering for the classic model but spread similar to the experimental results for the motivation model. Modeled data, n = 15 iterations, initialized to Q-values of 1 under the assumption that task contingencies had been learnt (see Methods for details). MAC performed better than AC as measured by the Euclidean distance between the values predicted by the model and the experimental results (AC = 0.78; MAC = 0.15). (b) Illustrative ROC space: red region shows overmotivated performance, green undermotivated, and purple freedom from extremes of motivational bias. (c) The performance of a typical mouse (experimental data) over 6 successive sessions during a training period with full-field stimulation. Each datapoint corresponds to the Hit/FA pair from a given time-point within the session, projected into ROC space. The points move away from the d′ = 0 diagonal with learning. The session trajectory varies considerably between sessions, but Hit/FA pairs rarely fall in the overmotivated (red) region of ROC space.

