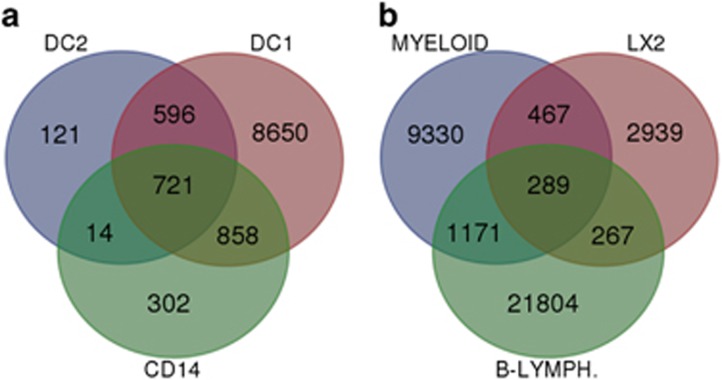
Figure 3.
Venn diagram of overlapping VDR-binding sites in (a) the three myeloid subsets DC1, DC2 and monocyte (CD14) and (b) overlap of the myeloid cell VDR-binding sites with the VDR-binding sites of a hepatic stellate cell line (LX2) and a B-lymphocyte cell line. Overlap of DC2 and DC1 was 91% of DC2 peaks; monocyte and DC1 was 83% of monocyte peaks; DC2 and monocyte was 51% of monocyte peaks; LX2 and myeloid was 19% of LX2 peaks; myeloid and B-lymph was 14% of myeloid peaks; and LX2 and B-lymph was 14% of LX2 peaks. In each case, the cell subset with the largest number of identified VDR peaks is used as the reference to compare overlaps.

