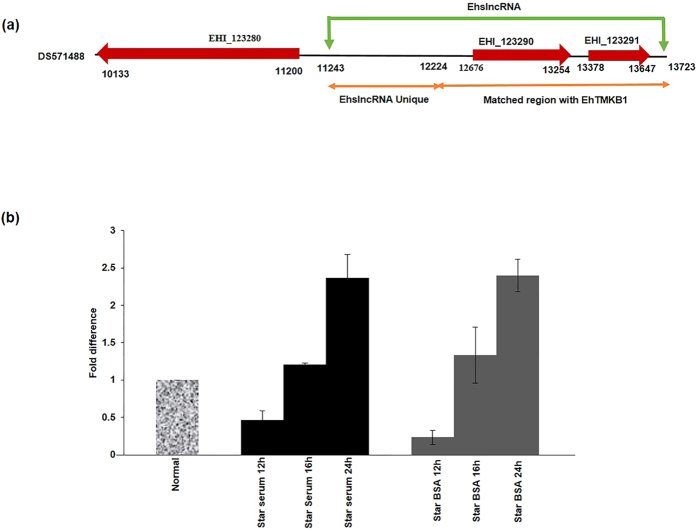
Figure 1. Time course of EhslncRNA expression on serum starvation.
(a) Diagrammatic representation of contig DS571488. Annotated genes (EHI_123290 and EHI_123291) and upstream gene EHI_123280 are marked with red arrows representing the direction of transcription of the putative annotated genes. Green arrows indicate the start and the end of the non coding transcript of EhslncRNA. Orange arrows indicate region unique to EhslncRNA and matched region with EhTMKB1 respectively. (b) Quantitative real-time PCR was performed for measuring the level of EhslncRNA and RNA polymerase II gene transcripts using cells treated under different conditions as indicated. All samples were analyzed in triplicates, in three independent experiments. Values are normalized to the endogenous control (RNA Pol II) and results are expressed as percent fold change in comparison to normal proliferating cells (taken as 100%). BSA (0.5 mg/ml) was added to the cells during serum starvation.

