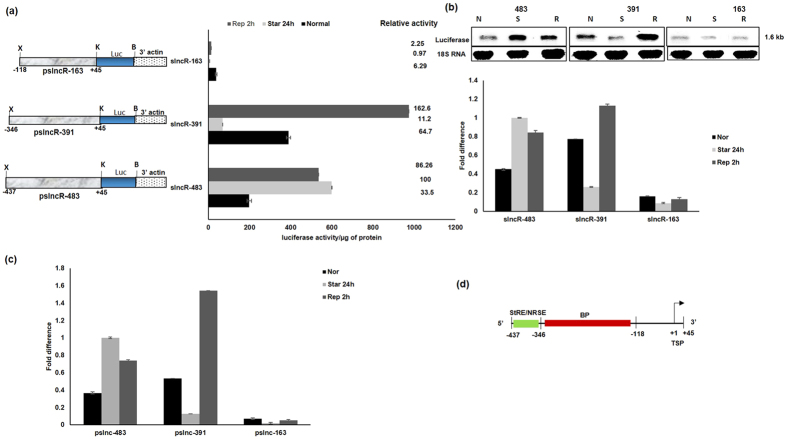
Figure 5. Deletion mapping of EhslncRNA upstream region.
(a) Schematic representation of EhslncRNA deletion constructs containing upstream sequences with indicated genomic positions that were cloned upstream of luciferase (luc) gene. X, K, B are XhoI, KpnI, BamHI sites respectively. Reporter luciferase activity of the stable transfectants under different conditions- normal proliferation, serum starvation 24 h and replenishment for 2 h after starvation. Activity of pslncR-483 under starvation condition is taken as 100 for relative fold calculation. (b) Stable transfectants of the indicated constructs were used and each of these cell lines was subjected to three different conditions – normal proliferation, serum starvation for 24 h and replenishment for 2 h after serum starvation. Total RNA was isolated and northern analysis was carried out using luciferase specific probe. The blot was reprobed with 18SRNA as loading control. Fold difference was calculated with respect to pslncR-483 construct under starvation condition and taken as 1 for fold calculation. (c) Quantitative real-time PCR was performed for measuring the level of luciferase gene and RNA polymerase II gene transcripts in different promoter deletion constructs of EhslncRNA and treated under different conditions as indicated in the cells. All samples were analyzed in triplicates, in three independent experiments. Values are normalized to the endogenous control (RNA Pol II) and results are expressed as percent fold change in comparison to pslncR-483 construct under starvation condition (taken as 100%). (d) Schematic representation of the promoter region of EhslncRNA. Arrow indicates transcription start point (TSP). Green box refers to starvation responsive element (StRE)/negative repressor of serum element (NRSE). Red box indicates basal promoter (BP) region.

