
Figure 2.
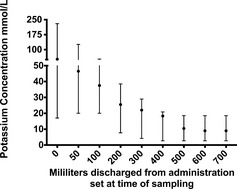
Potassium concentration of discharged fluid over time of 6 1 L bags of 0.9% NaCl supplemented with 20 mmol of potassium chloride via rapid injection (≈10 seconds) and no mixing performed. The circle represents the median value and the error bars represent the range. Fluid administration rate was 100 mL/h.