Figure 2.

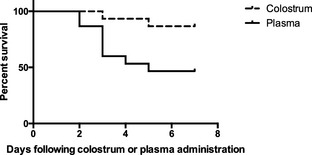
Kaplan–Meier curves for the colostrum group (CL; n = 15) and plasma group (PL; n = 15) groups depicting percentage survival of calves after the start of the study.

Kaplan–Meier curves for the colostrum group (CL; n = 15) and plasma group (PL; n = 15) groups depicting percentage survival of calves after the start of the study.