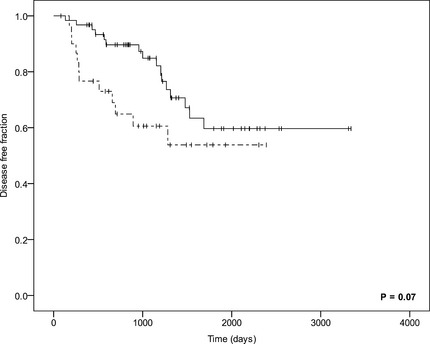
Figure 3.

Kaplan–Meier curves comparing the disease‐free period in dogs with high (>33 nmol/L), dotted line, n = 31) and low (<33 nmol/L), continuous line, n = 62) plasma cortisol concentrations at 4 hours after hypophysectomy (P = .07). Censored cases are represented by vertical bars.
