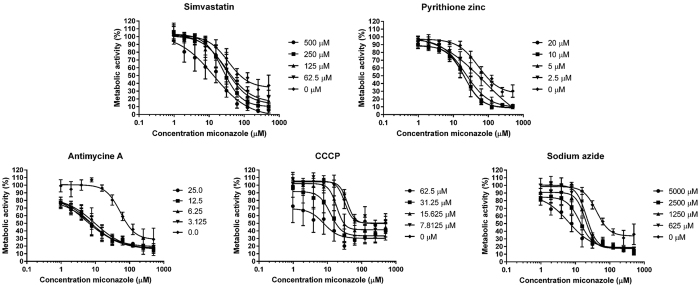
Figure 3. Metabolic activity of C. albicans biofilms treated with a combination of miconazole and simvastatin, pyrithione zinc, CCCP, antimycin A and sodium azide.
The control curve of miconazole alone is represented by diamonds, whereas combinations of miconazole with decreasing concentrations of other compound are indicated by circles, squares, triangles and reverted triangles. Data are mean ± SEM of five (n = 5) biologically independent experiments (each consisting of three repeats), determined with the metabolic activity dye CTB.

