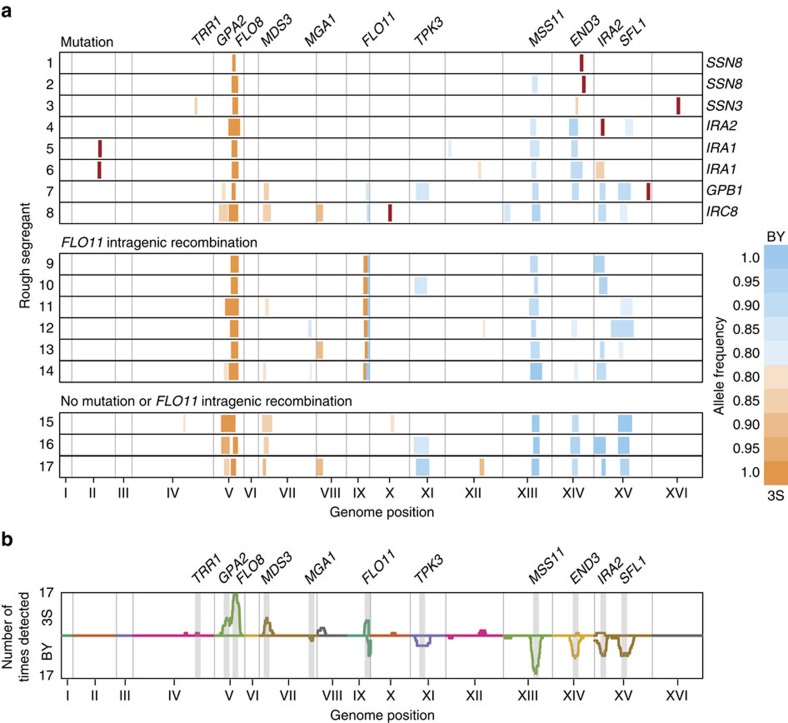
Figure 2. Genetic mapping results.
(a) Genetic mapping data for each rough segregant is shown horizontally. The mapping results correspond to data from backcrosses of each segregant to BY and 3S, as depicted in Fig. 1b. Vertical bars represent detected loci, with blue and orange colouring indicating cryptic variants from BY and 3S, respectively. The width of each locus corresponds to the region of that locus that exhibits a logarithm of odds score of at least 5. De novo mutations are shown in red, with the specific mutated gene noted to the right of the panel. The allele frequencies of detected loci in a given backcross mapping population are provided, with the colour scale illustrated to the right of the figure. (b) The number of times each cryptic variant was detected across the different mapping populations is plotted. Counts were determined by summing the number of times each segregating marker was detected in backcrosses to a particular parent. Results corresponding to de novo mutations were excluded.

