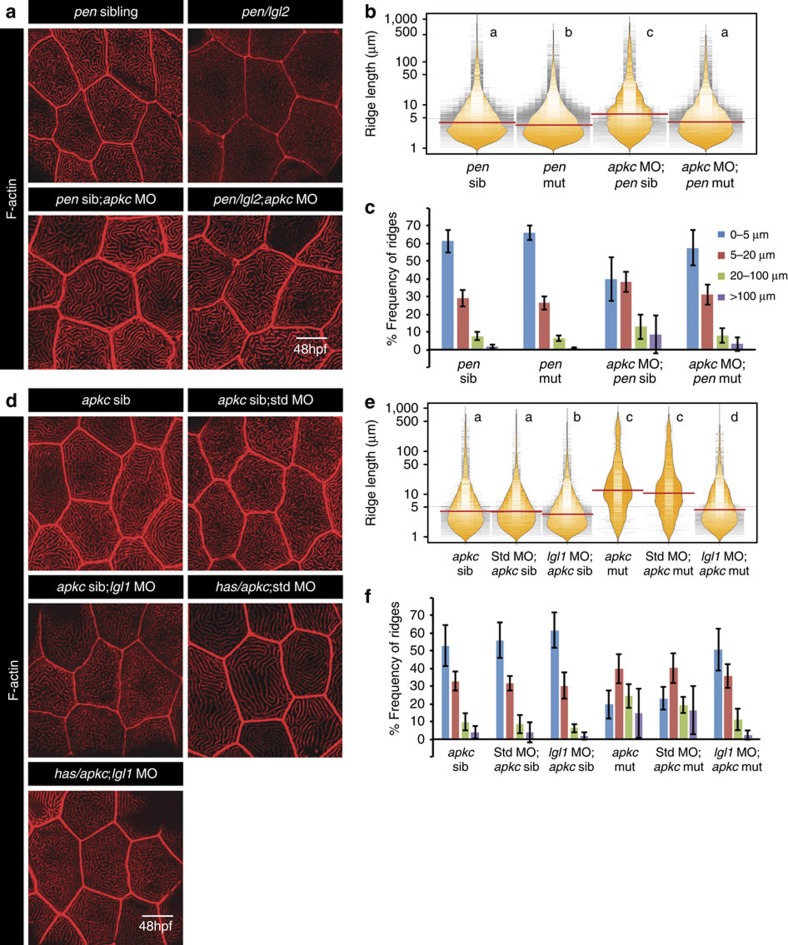
Figure 5. Microridge elongation in aPKC-deficient embryos occurs in an Lgl-dependent manner.
Phalloidin stainings (a,d) at 48 hpf in genotypes mentioned. Ridge length estimation followed by visualization of the spread and frequency of their lengths and medians using bean plots (b,e). The frequency distribution of ridges (c,f) in short (0–5 μm), intermediate (5–20 μm), long (20–100 μm) and very long (>100 μm) categories across the above mentioned genotypes. In b and e the distributions sharing the same alphabet do not differ significantly (Dunn's multiple comparisons test, P-value<0.05). Error bars in c and f represent the s.d. Scale bars in a and d corresponds to 10 μm.

